DP-900: Azure Data Fundamentals Series
Discover the power of cloud computing! The Cloudguides in this series follow labs related to the DP-900: Azure Data Fundamentals Certification. This introductory series will show you the basics of data management in Azure, including creating and managing relational and non-relational databases, utilizing Azure services like Blob Storage, Cosmos DB, and data warehousing tools. Get started using Azure to manage and explore data in the cloud.
Target Audience: Data Professionals Series Type: Fundamentals, learn the basics
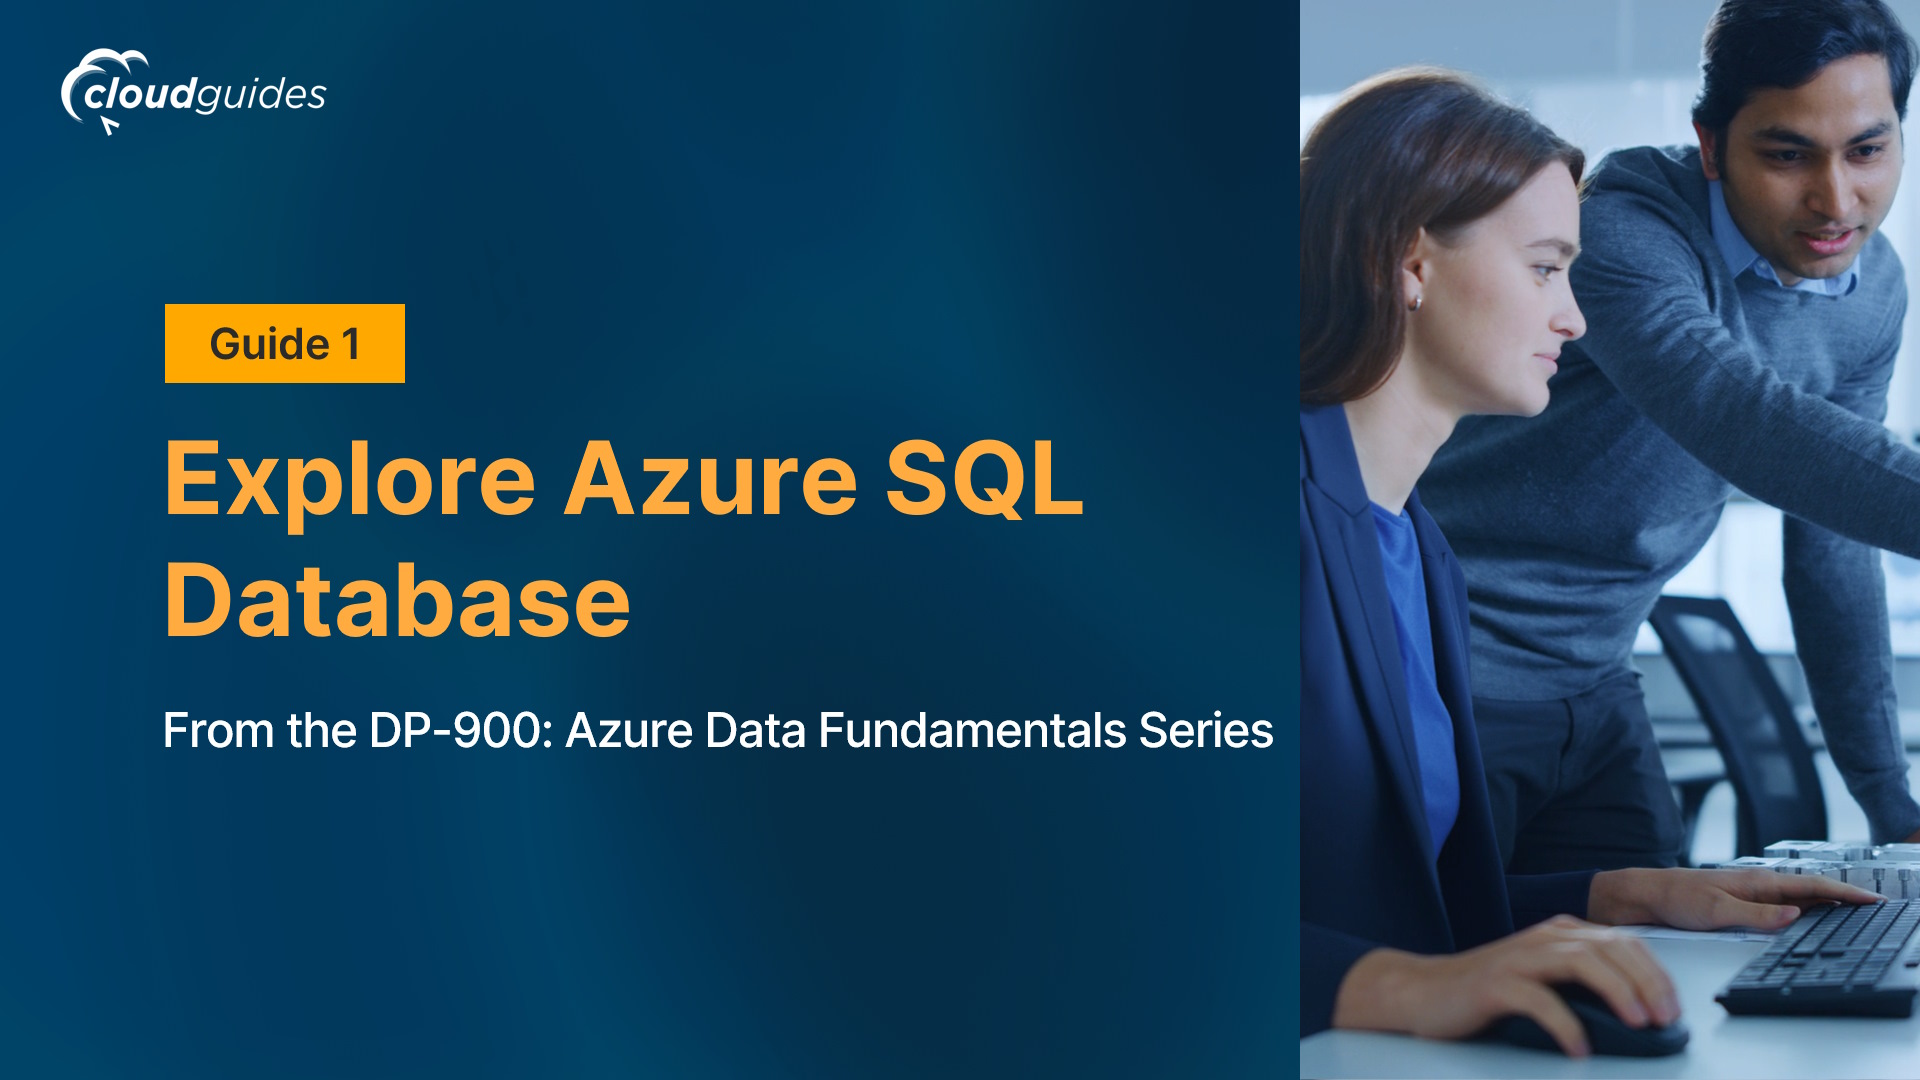
In this guide, you’ll see how to provision an Azure SQL Database resource in your Azure subscription, and then use SQL to query the tables in a relational database.
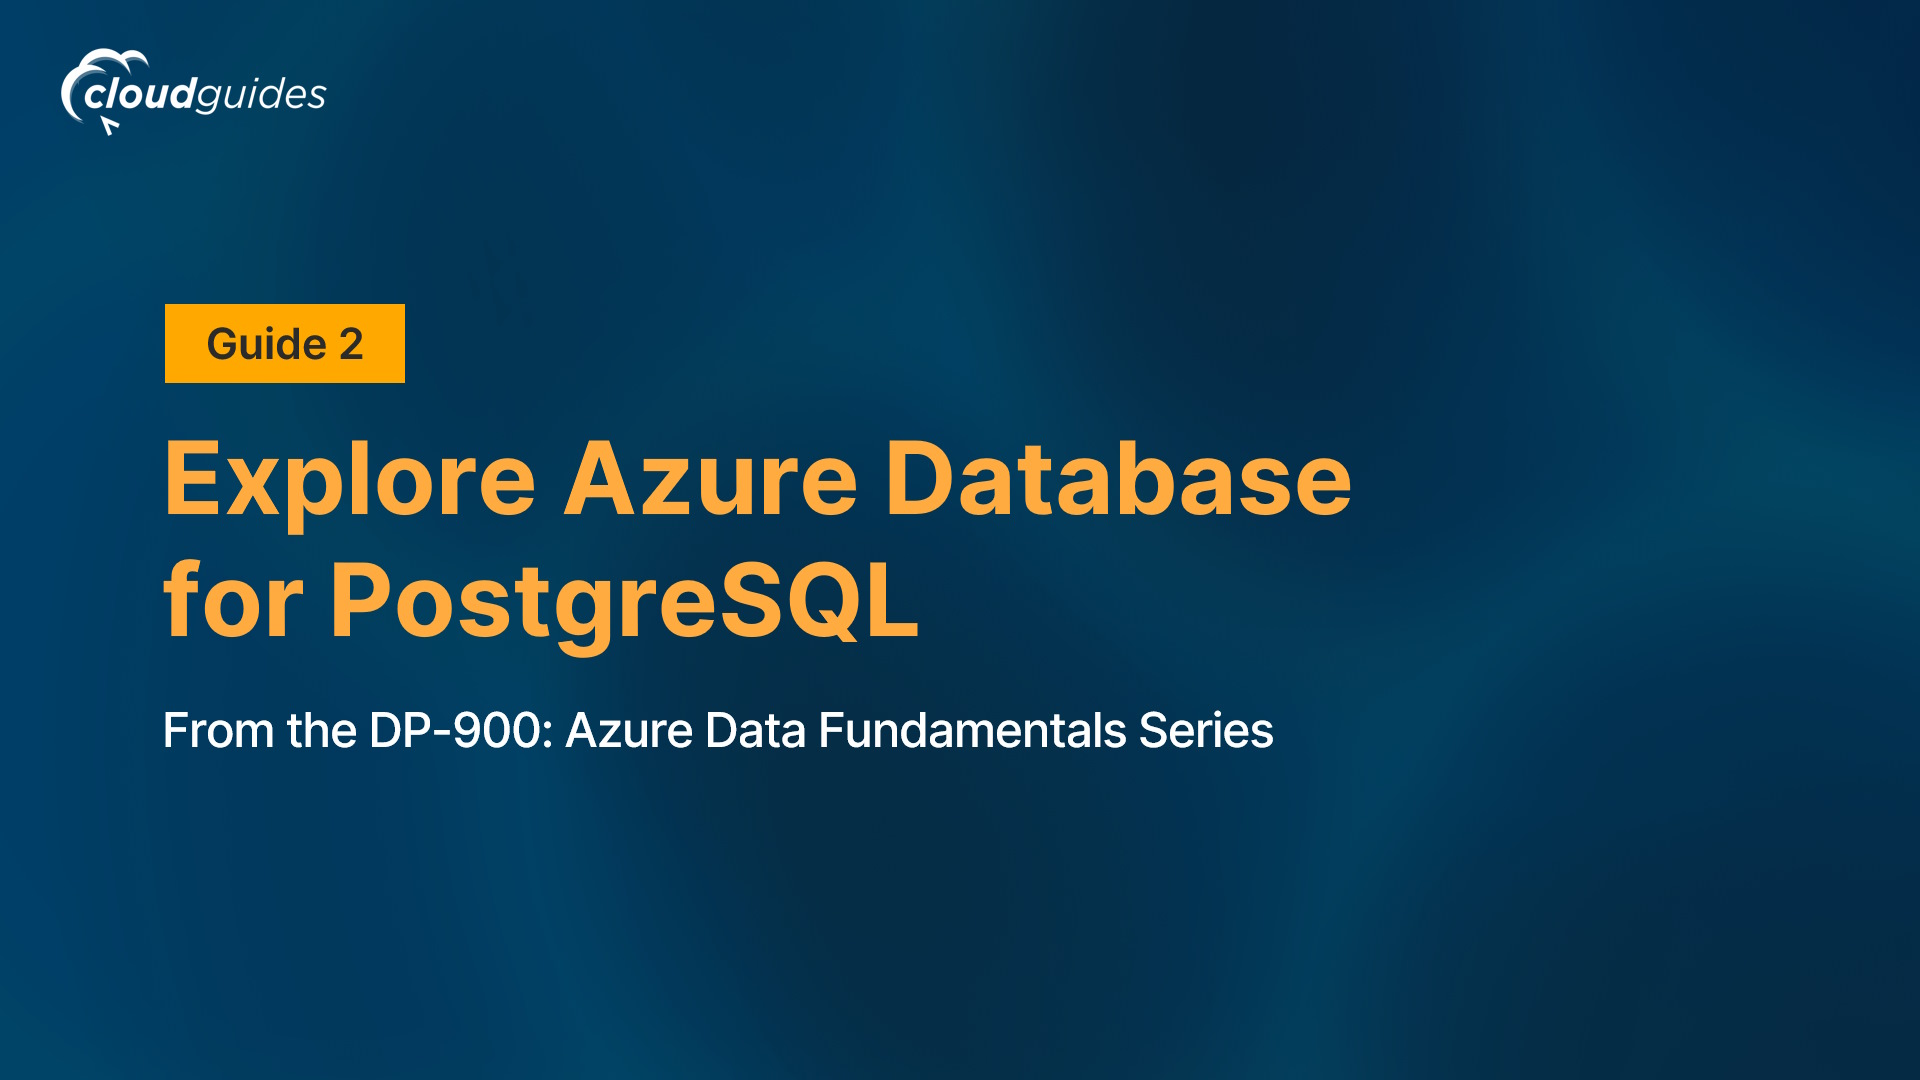
In this guide, you’ll see how to provision an Azure Database for PostgreSQL resource in your Azure subscription.
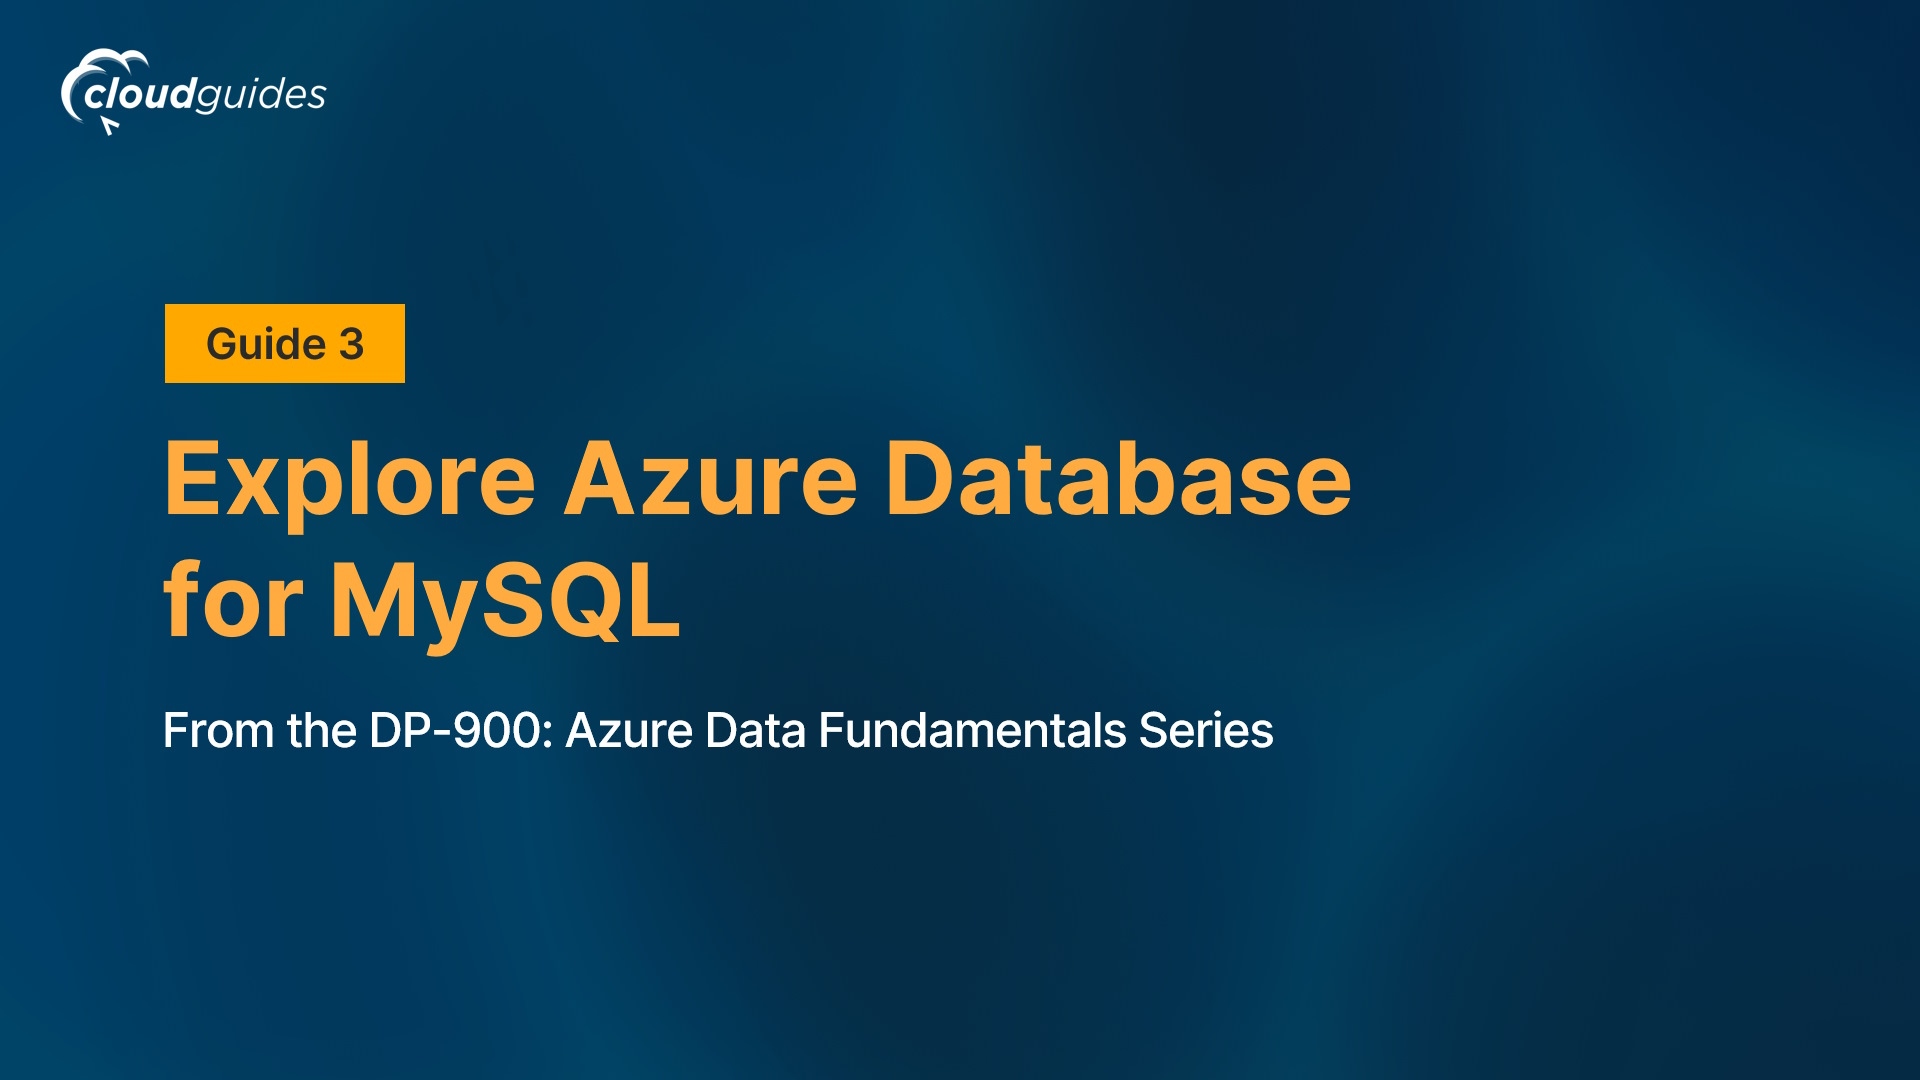
In this guide, you’ll see how to provision an Azure Database for MySQL resource in your Azure subscription.
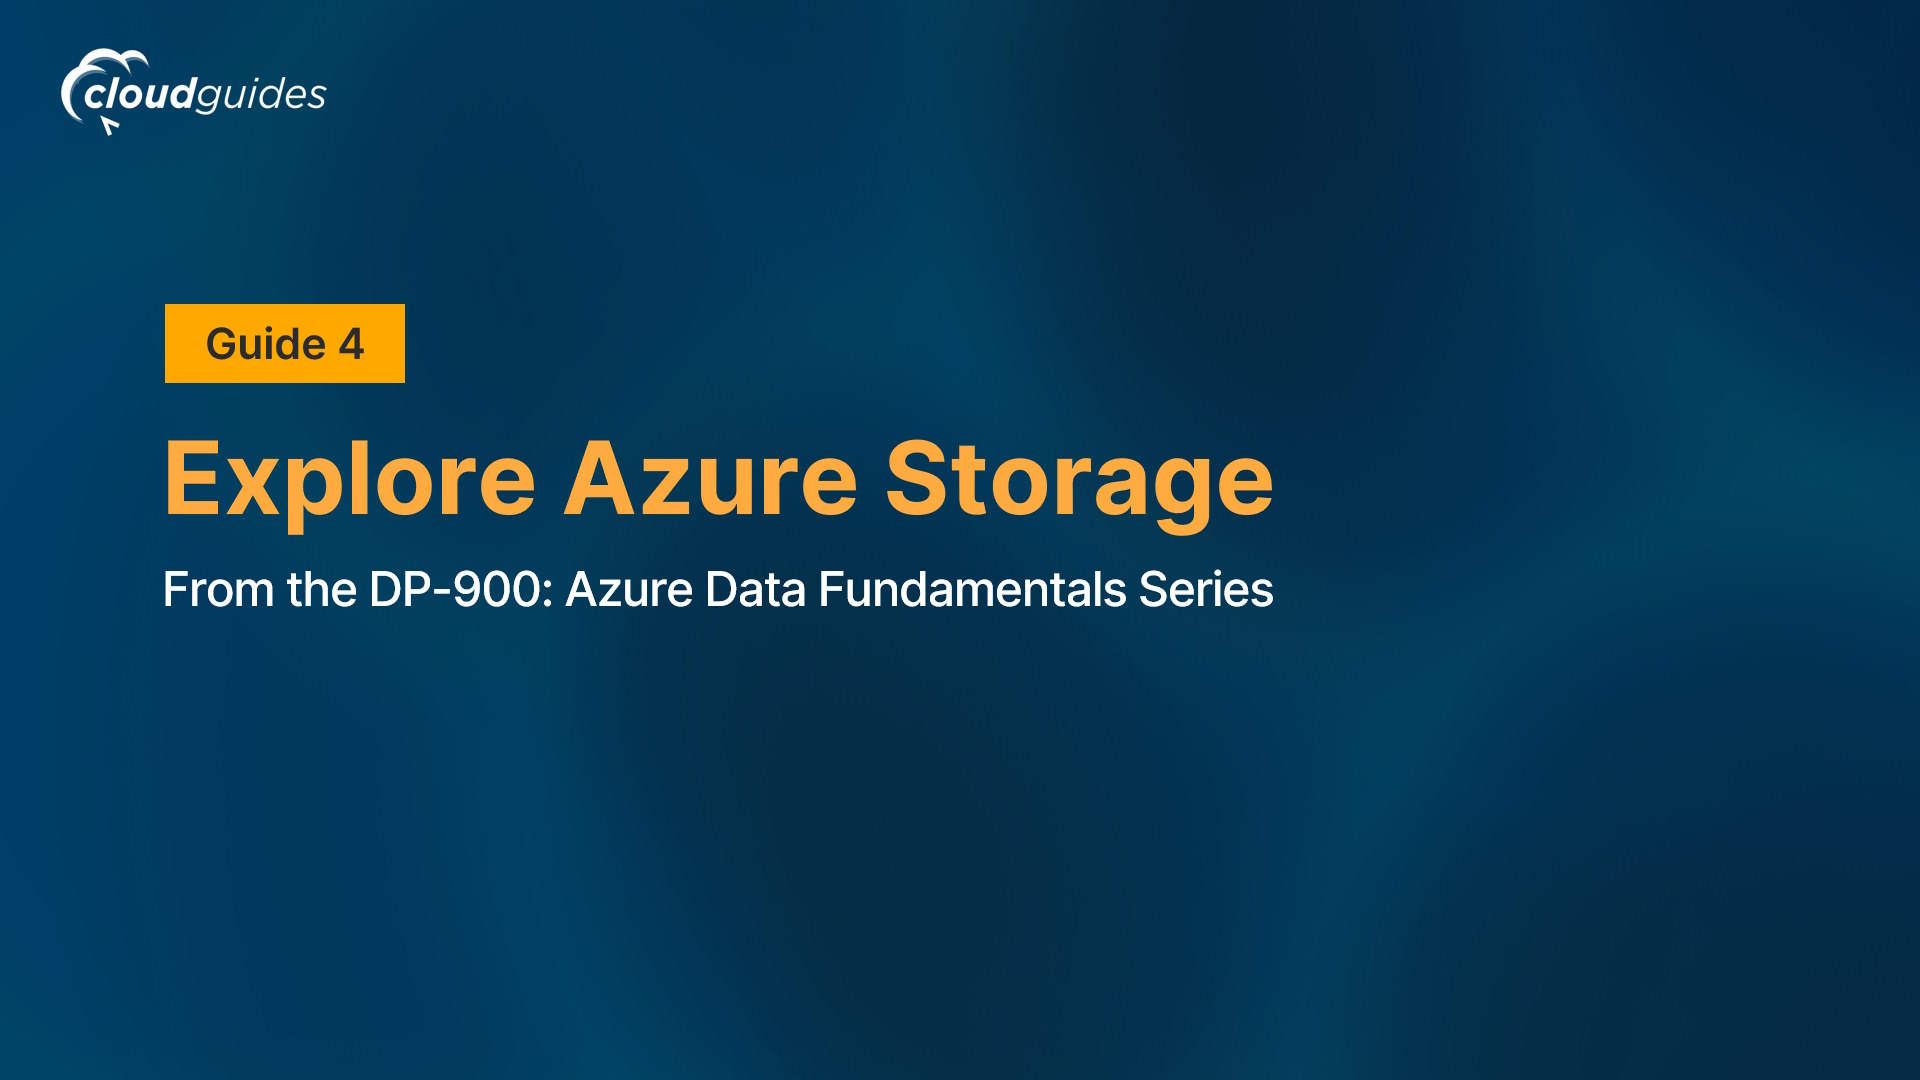
In this guide, you’ll see how to provision an Azure Storage account in your Azure subscription, and explore the various ways you can use it to store data.
In this guide, you’ll see how to provision an Azure Cosmos DB database in your Azure subscription, and explore the various ways you can use it to store non-relational data.
In this guide, you’ll see how to provision an Azure Synapse Analytics workspace in your Azure subscription, and use it to ingest and query data.
In this guide, you’ll explore data ingestion and analytics in a Microsoft Fabric Lakehouse.
In this guide, you’ll see how to provision an Azure Stream Analytics job in your Azure subscription, and use it to process a stream of real-time data.
In this guide, you’ll see how to use Spark Structured Streaming and delta tables in Azure Synapse Analytics to process streaming data.

In this guide, you’ll see how to use Azure Synapse Data Explorer to analyze time-series data.
In this guide, you’ll explore real-time analytics in Microsoft Fabric.
In this guide, you’ll see how to use Microsoft Power BI Desktop to create a data model and a report containing interactive data visualizations.